
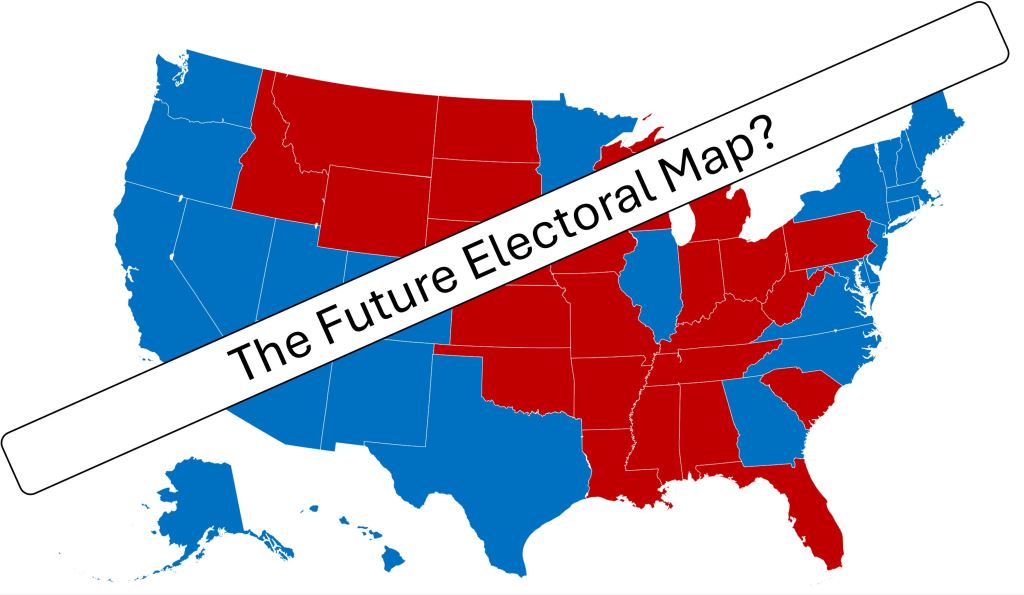
If current trends continue, Democrats will win most of the next seven presidential elections. With these models, the next few elections will likely be the last hurrah for the Republican Party. Is this right, though? Is the Democratic Party really this strong, and the Republican Party not? To find out, in this article, we will explore the following:
- What are the current trends? What are the assumptions?
- What is right about those numbers?
- What is wrong with those numbers?
So, what are these rather surprising trends that back up such a big claim? Well, unfortunately for us, it, as always, depends. This depends on where you start that trend. For our practice, we broke it down into four starting points, with a fifth as the average for the results. These beginning points and why I chose them are in the table below:
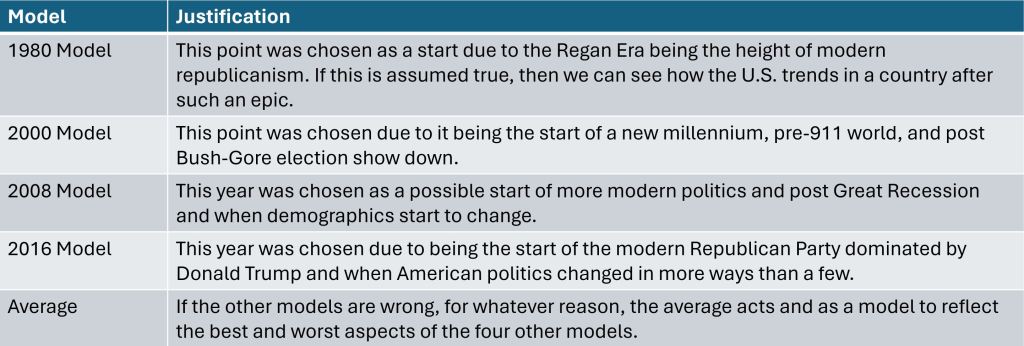
The years in each model act as the starting point of the trend. For example, the 2000 Model takes into account the election results of the 2000 election to the 2020 election, while the 2016 Model uses the results from the 2016 and 2020 elections. To read more about how I calculated the trends and the data sets, please see the accompanying PDF.
Before going to the results of these projections, it is essential to cover the assumptions baked into these models. The two main hypotheses are:
On the state level, the states will continue to become more Democratic or Republican over time based on their voting trends starting in 1980, 2000, 2008, or 2016.
Certain states will see more or less electoral votes after the 2030 and 2040 censuses.
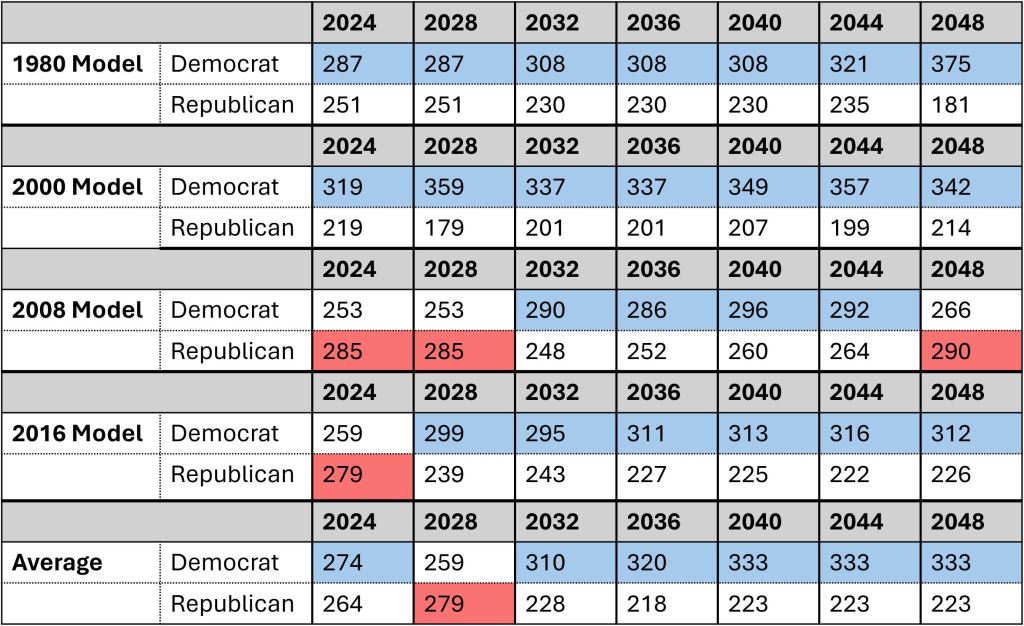
In the following sections, we will reevaluate why this assumption could be right or wrong, but for now, let’s roll with it. The results of this found the following:
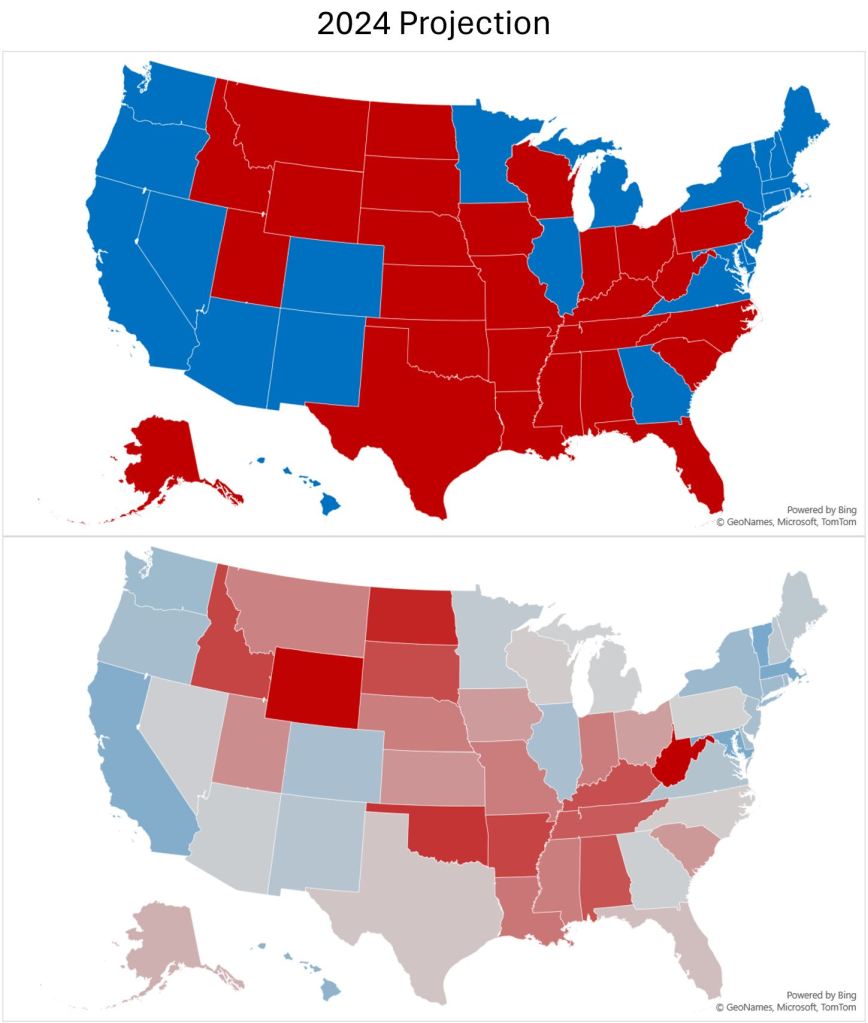
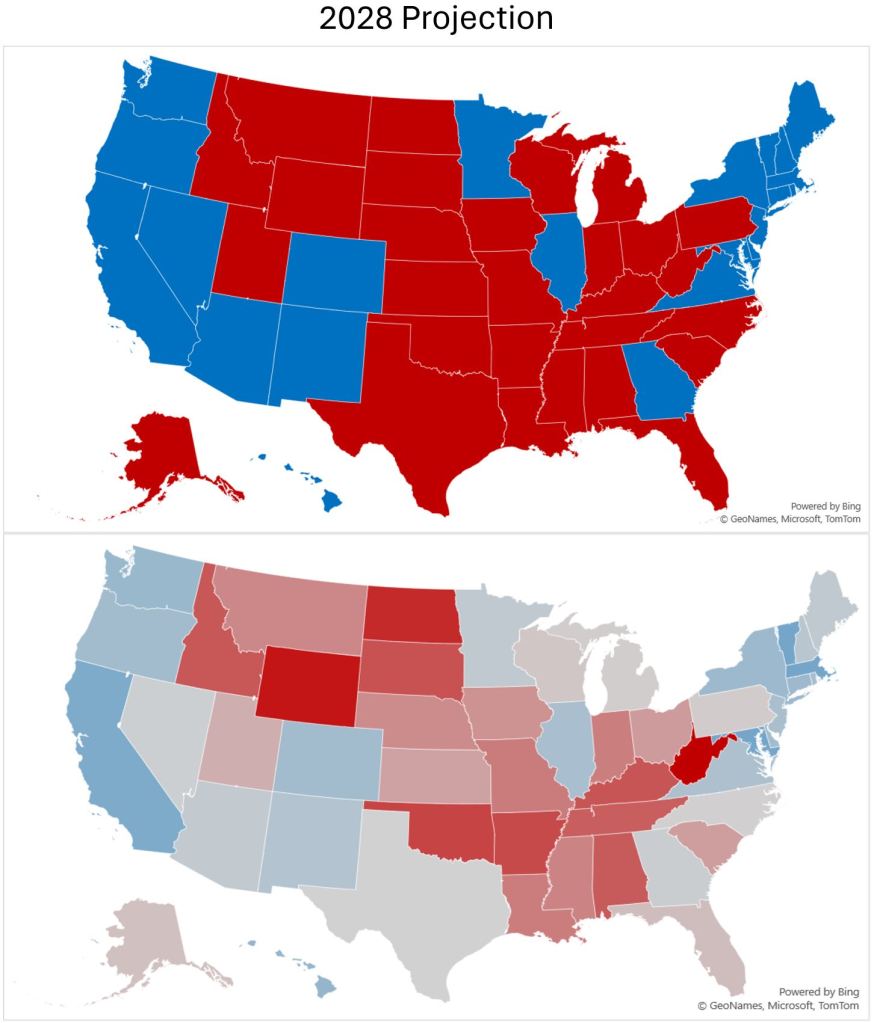
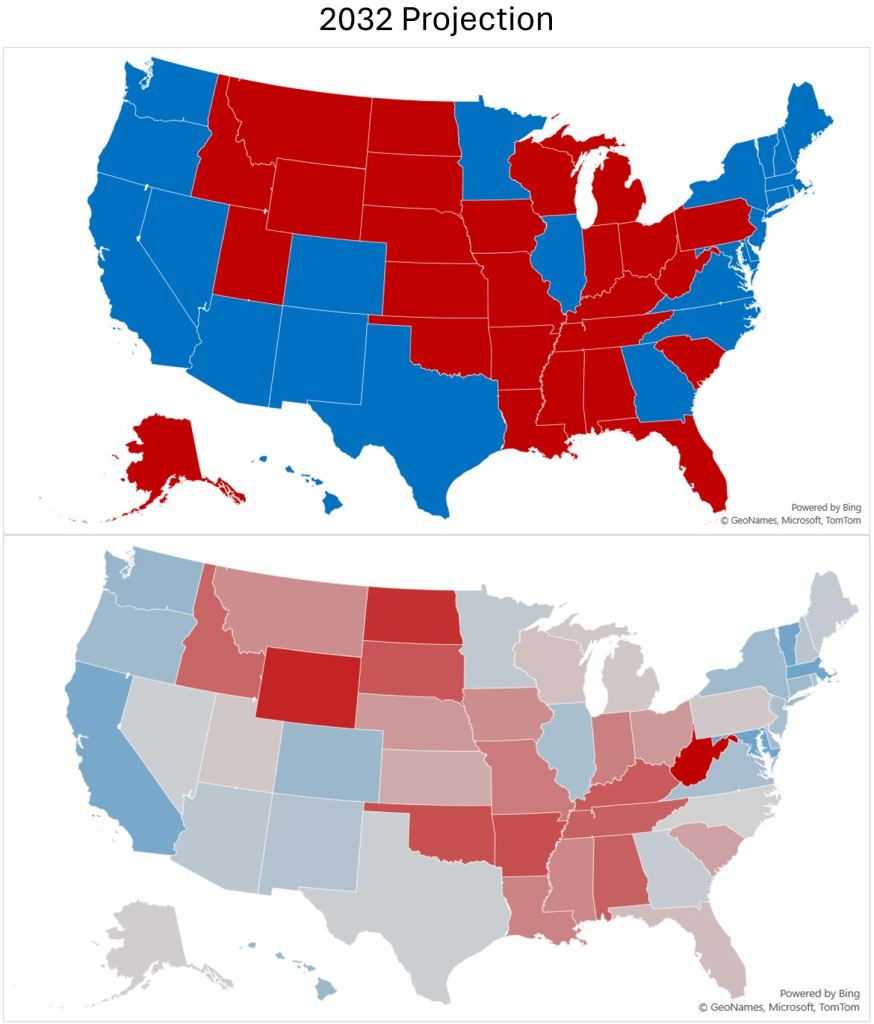
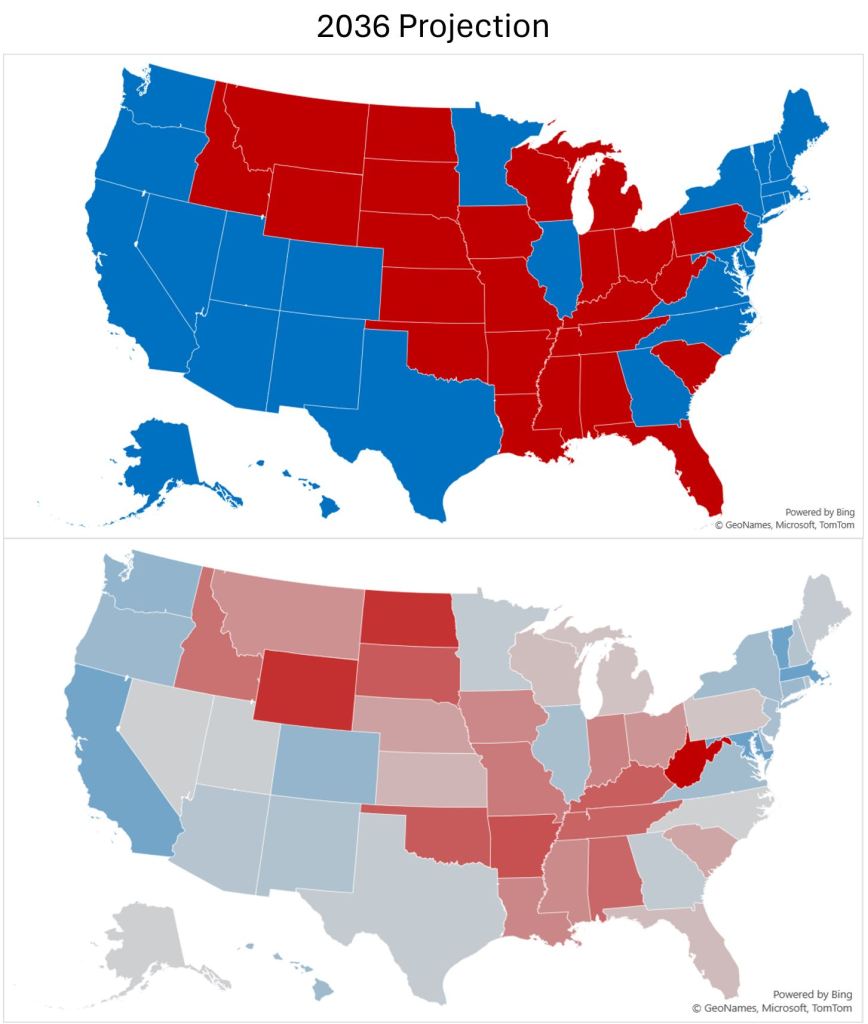


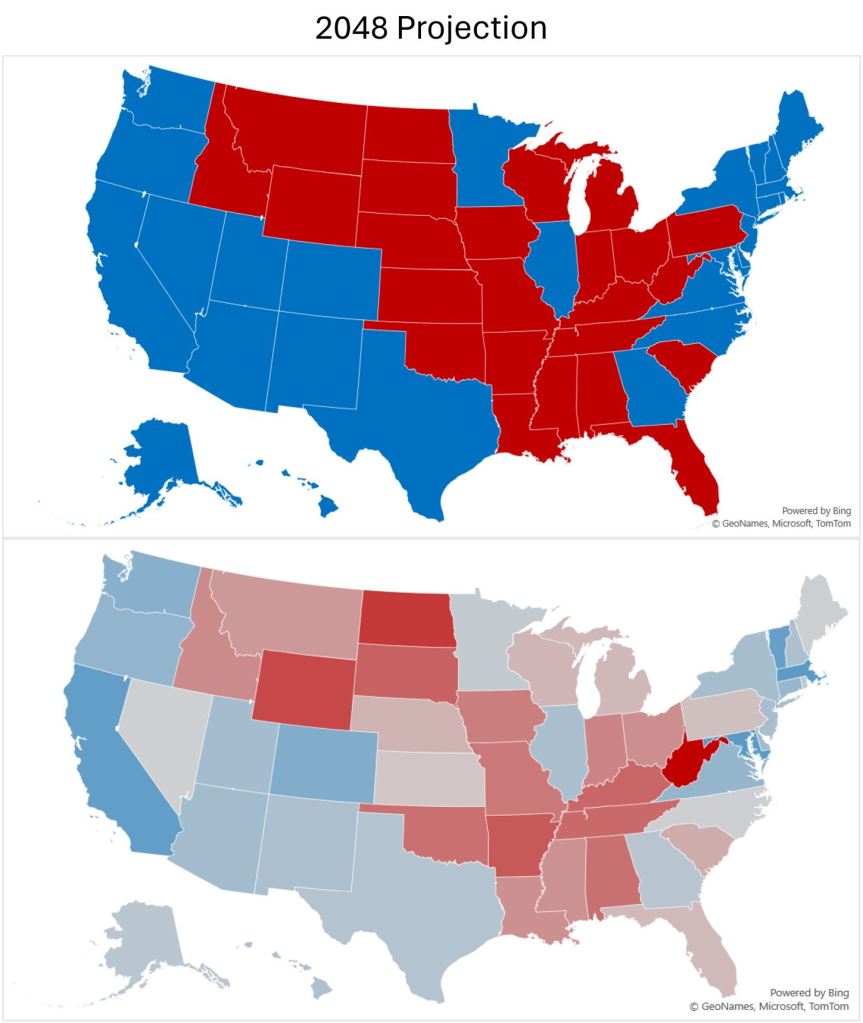
We can see more detail on the state level in the slideshow above. In the bottom map, the darker the color, the more likely the state is to vote for that party.
As we can see, the results show us that Democrats are likely to win more times than not for all of the models, while Republican wins see smaller margins. Interestingly, the 2016 and Average Models see very close election results. These two appear most likely according to current political events unless there are significant, unexpected changes.
Why these projections may be correct.
While these models are nothing more than trendlines, they can help us see some patterns on a very high level. For example, Texas is both growing in population and becoming more democratic. If or when that happens, that could be 40-46 electoral votes for Democrats, nearly as much as California at 49-54. Together, that would be almost 20% of the total electoral college or 35% of the vote needed to reach 270 to win. When Texas becomes a swing state, the influence of the Republican Party is certainly in question. This event will likely happen in the next decade if current trends continue.
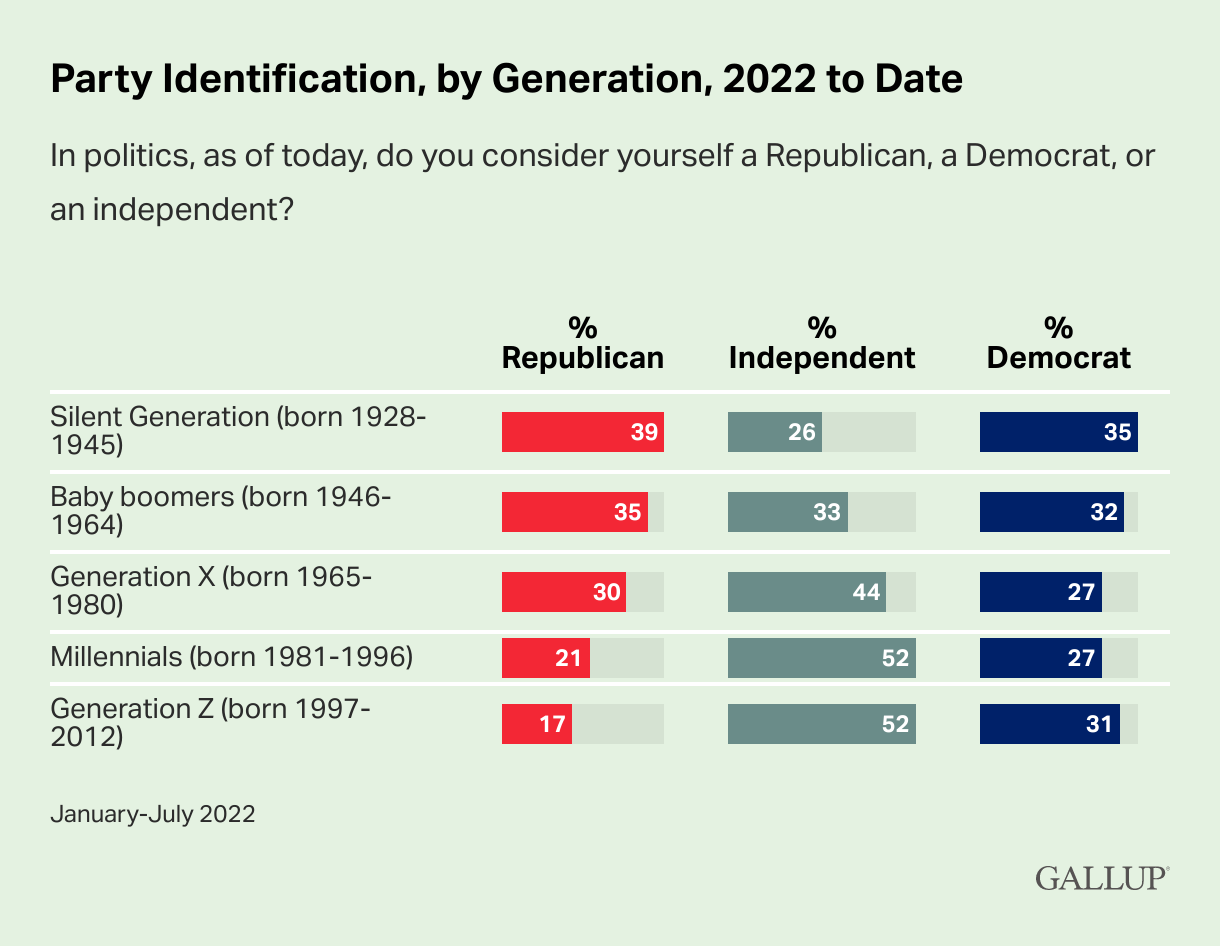
Beyond this data, there are other signs that the Republican Party has declined and will likely keep declining. This topic will be an article in the future, but let’s introduce them here. To start, the Republican Party has not won the popular vote since 2004, and that does not seem to be changing anytime soon. Next, according to Gallop, the younger generations are less likely to be Republican but more likely to be independent or Democratic, as seen in the figure below.
Beyond those demographic trends, there are additional disturbing signs for the Republican Party. The majority right-leaning Supreme Court is seeing near-record low approval ratings1 in part due to walking back abortion rights. In 2023, the Republican Congress passed a near-record low number of laws2. The expected “red waves” of 2022 and 2023 never happened3. Lastly, the party barely appears to be able to govern itself in cases such as removing their own Speaker of the House with signs this may happen once more4.
These reasons do not inspire confidence. The best card the party currently has is Trump, and we must ask, what happens after he is gone? What happens to the party then? The answers do not look great since the party lacks any singular power such as Trump, and those that could have been (Mitt Romney, Ted Cruz, Ron DeSantis, Matt Gaetz, Marjorie Taylor Greene, and others) are either causing the party to split or are retiring.
Why these projections may be wrong.
Now that we have seen why these trends may be on the right track, let us look at some possible reasons why these models are wrong. First, let us look at some states, mostly swing states, and see what is happening.

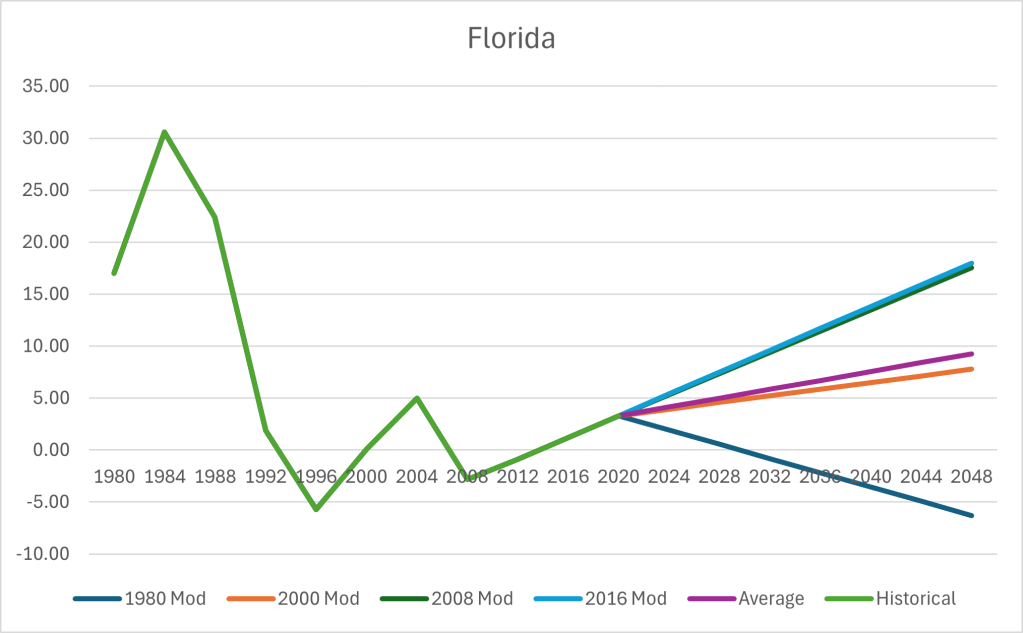


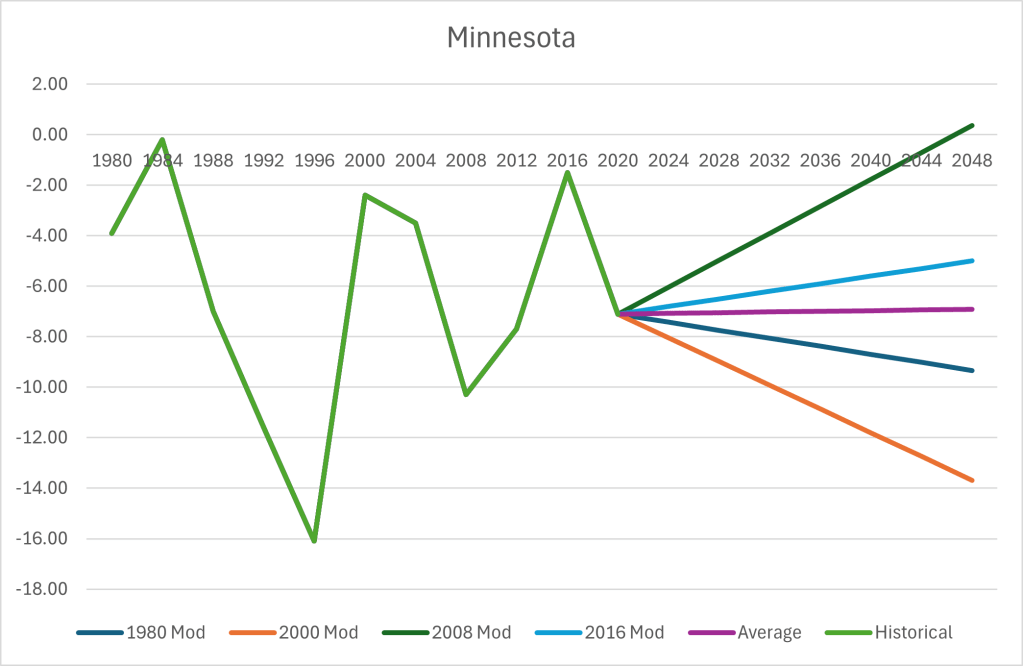
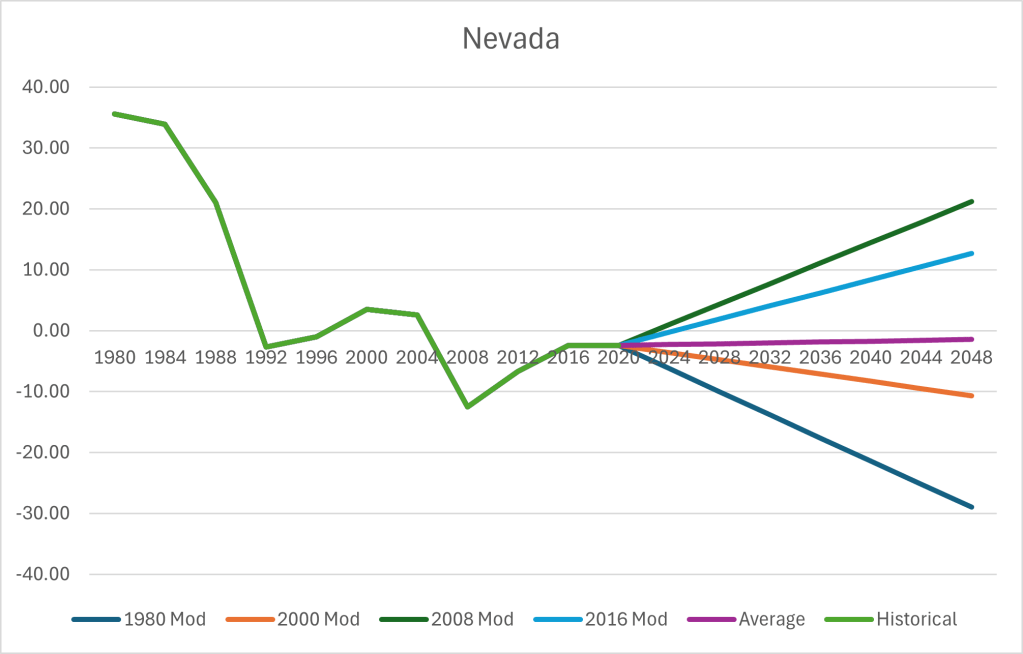
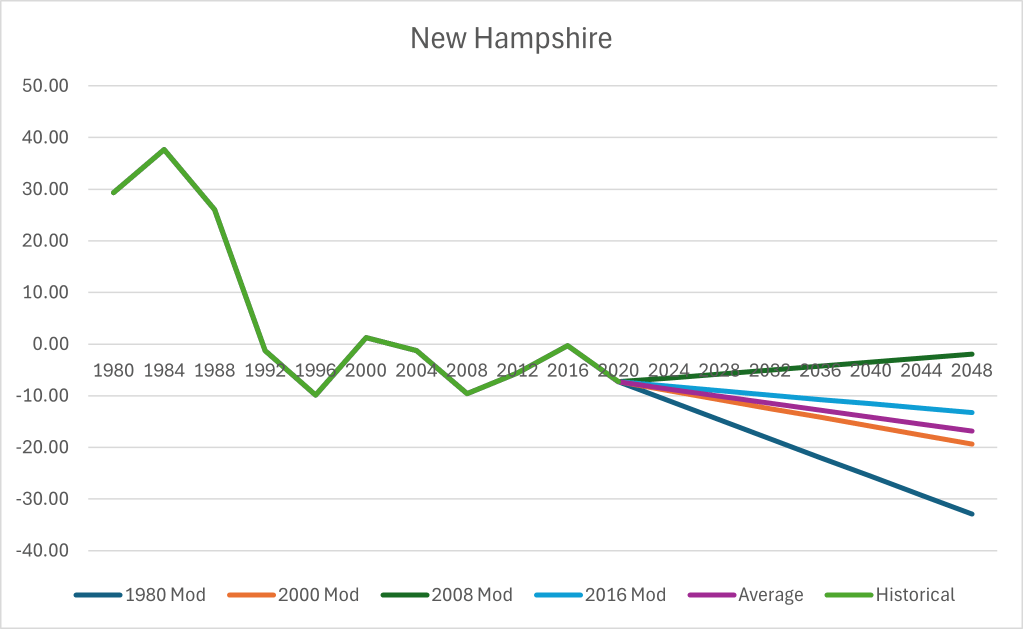
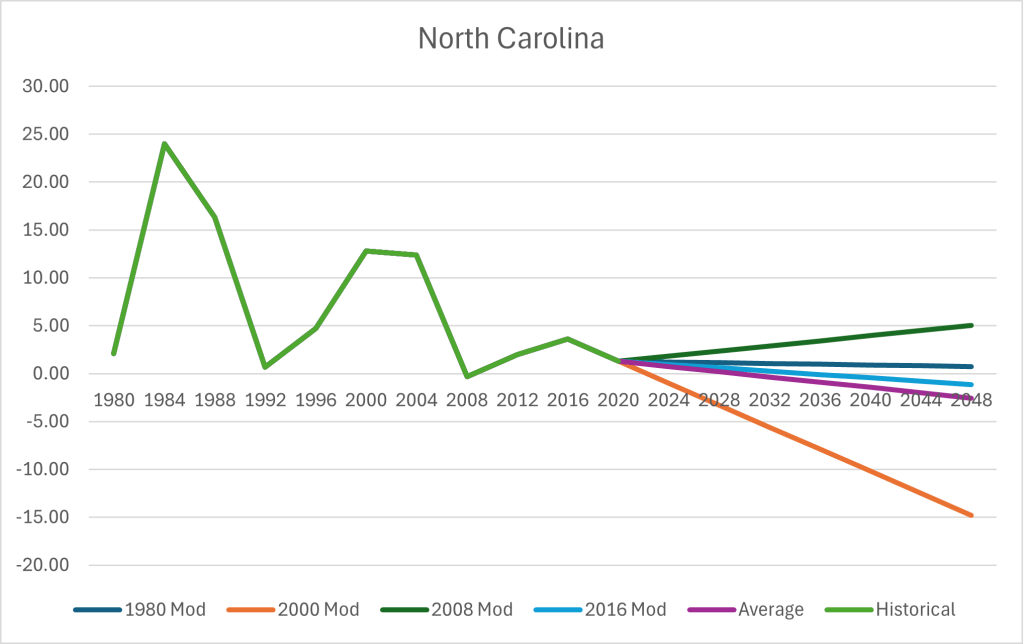
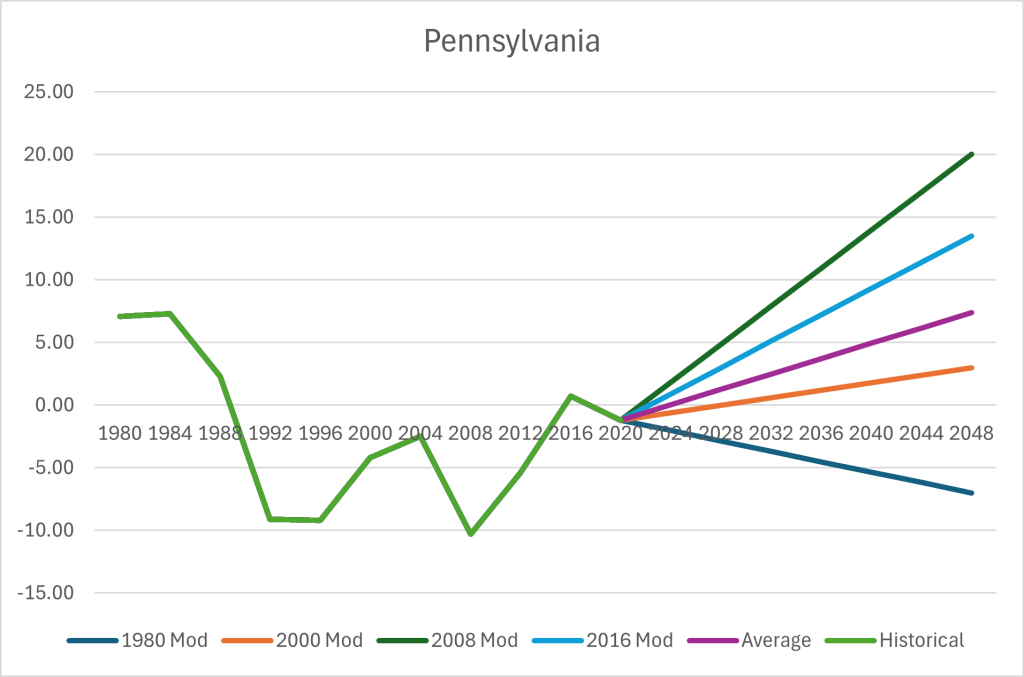
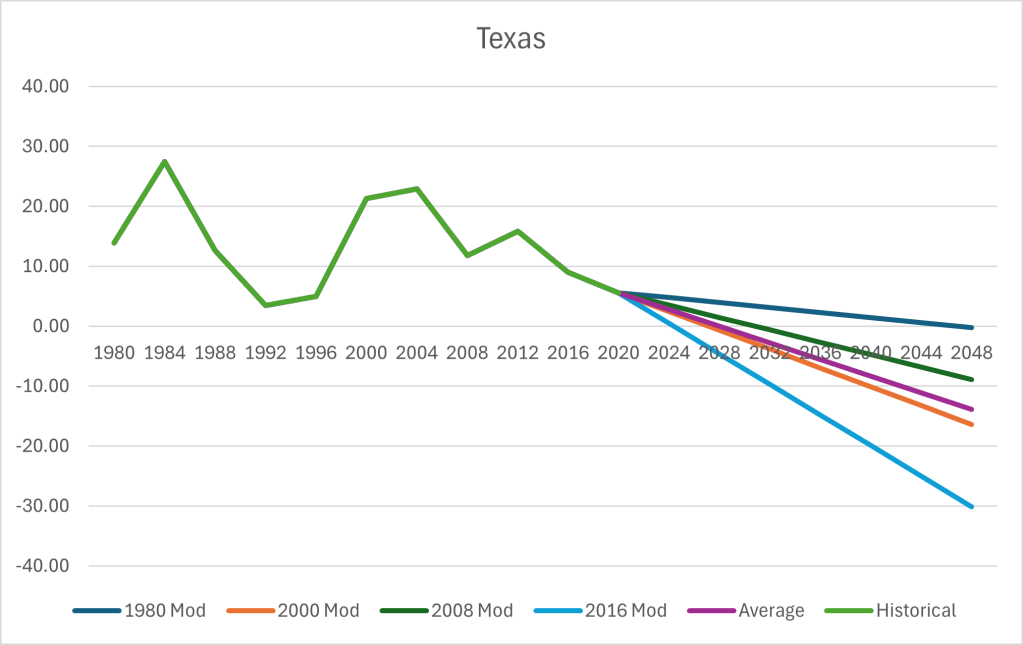
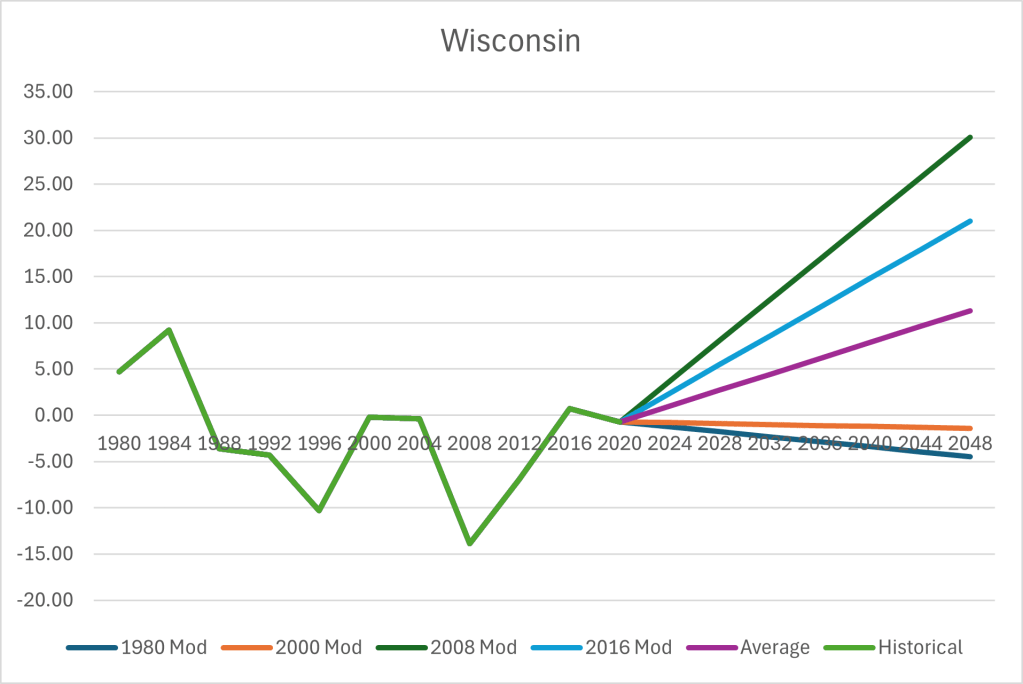
These images show the historical differences between the percentage of citizens who voted for Democrats and Republicans. If the number is positive, then the state voted for a Republican candidate; if negative, then they voted for a Democrat. As we can see, some states, such as Georgia and New Hampshire, are trending Democratic for the most part, but one model shows them becoming more Republican. Some have wide spreads like Minnesota, likely meaning that based on current trends, they will continue to be swing states for the near future. Others like Arizona and Texas show that all trends are leading both states to become more Democratic. Here is where we can see the first likely flaw.
This first point of objection is that if trends from 2016 continue, Texas has a non-zero chance of being Democratic in the 2024 election. This contrasts with the fact that Trump won the state in 2016 and 2020 with 9 and 5.2 points more than Biden. That likely means it won’t flip this year, but it will likely happen between 2028 and 2032. These inaccuracies are the problem with trendlines since they assume that the current rate of change will continue, unchanged, for a certain amount of time.
Besides these problems, there are other possible reasons why these models could be wildly off. Such reasons could be:
- As younger generations age, they will become more right-leaning than they are now.
- A new Republican candidate becomes incredibly popular, or Democrats push forward unpopular candidates/become less popular.
- The number of traditionally Democratic voting minorities keeps leaving the party for the right.
- Either party could split and evolve into a third large party, with the fallout leading to a new status quo.
What does this all mean?
As we look at what these results mean, it is essential to remember that no one can see the future, least of all me. However, with that said, these models have given us a result with that being:
- If current trends continue, on the state level, Democrats are expected to win most of the next seven elections.
- If current trends continue, we as a nation will become more Democratic.
In conclusion, as we saw above, many tangible current events are concerning for the Republican Party, while the Democratic Party does not appear to have the same problems. The best hope this data suggests the Republican Party has is that current trends will not continue for them as they face a march towards irreverence. Time will tell if these trends persist, or perhaps a new variable will change the game once more.
What are your thoughts? Do you agree or disagree? If so, why?
Author:

Sources:
2030 Apportionment Forecast – 2022. The American Redistricting Project. (2023, March 8). https://thearp.org/blog/apportionment/2030-forecasted-apportionment/
Brenan, M. (2023a, October 3). Views of Supreme Court remain near record lows. Gallup.com. https://news.gallup.com/poll/511820/views-supreme-court-remain-near-record-lows.aspx
Brenan, M. (2023b, October 3). Views of Supreme Court remain near record lows. Gallup.com. https://news.gallup.com/poll/511820/views-supreme-court-remain-near-record-lows.aspx
Historical presidential election information by state – 270towin. 270toWin.com. (n.d.). https://www.270towin.com/states/
Jones, J. M. (2023, May 31). Millennials, gen X clinging to independent party ID. Gallup.com. https://news.gallup.com/poll/397241/millennials-gen-clinging-independent-party.aspx
Lillis, M. (2024, January 13). Democrats willing to help GOP speaker save job – for a Price. The Hill. https://thehill.com/homenews/house/4405928-democrats-willing-to-help-gop-speaker-save-job-for-a-price/
McDaniel, E. (2023, December 22). Congress passed so few laws this year that we explained them all in 1,000 words. NPR. https://www.npr.org/2023/12/22/1220111009/congress-passed-so-few-laws-this-year-that-we-explained-them-all-in-1-000-words
Siders, D. (2022, November 9). The Red Wave that wasn’t: 5 takeaways from a disappointing night for the GOP. POLITICO. https://www.politico.com/news/2022/11/09/2022-election-results-analysis-and-takeaways-00065878
Accompanying PDF:

Leave a comment